Global Equities
United States
With economic storm clouds obscuring the outlook for U.S. growth, investors may want to prepare their portfolios for ongoing market volatility. “The environment is changing rapidly and significant headwinds have emerged,” says U.S. economist Jared Franz. “But clear areas of strength can be found across the American economy.”
Is a recession on the horizon? “Recessions are a natural and inevitable part of the business cycle, and a downturn is likely on the horizon,” says Franz. “That said, I expect the next recession to be a healthy correction that addresses imbalances, not the kind of wipeout investors endured in 2008.”
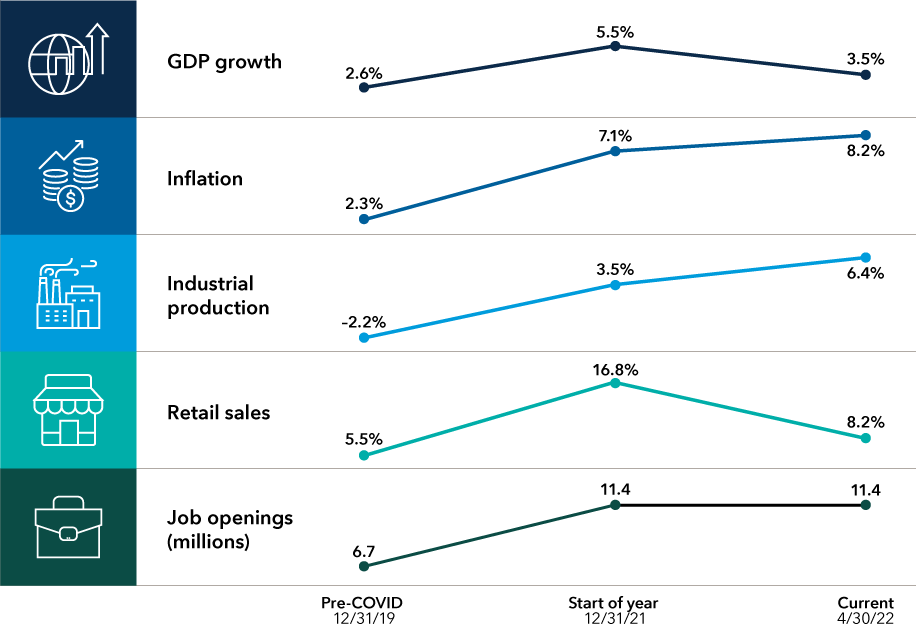
In fact, rays of light are breaking through the clouds. Relatively low consumer debt and robust wage growth have provided tailwinds to consumer spending. Although retail sales in the U.S. have moderated since the start of the year, they remain solid, rising 8.2% year over year as of April 30. Likewise, corporate balance sheets are healthy and industrial production is soaring.
That said, the risks are clear. Inflation is elevated and pricing pressures have broadened, keeping the U.S. Federal Reserve on its course of interest rate hikes. Supply chain disruptions and rising costs have eroded corporate profit growth. Geopolitical pressures such as the war in Ukraine and COVID lockdowns in China magnify these risks.
The U.S. economy remains strong, but risks are rising

Source: Refinitiv Datastream. The first four metrics are shown as year-over-year growth rates. The last is job openings (by the millions). Dates for Current column are 3/31/22 for GDP growth and 4/30/22 for all others.
All of this adds up to an American economy firmly in late-cycle territory. What does that mean for investors? “Late cycles are not predictive of recessions, but they do tell you that the economy’s ability to bounce back from shocks is reduced,” Franz adds. “I view this as a time to pursue all-weather portfolios built to withstand a variety of risks.”
Here are four investment themes to consider for the remainder of 2022 and beyond.
1. Rising dividends can counter inflation
When market volatility is rising, boring is beautiful. That’s why dividend-paying stocks, many of them in dull and dependable industries, present compelling investment opportunities.
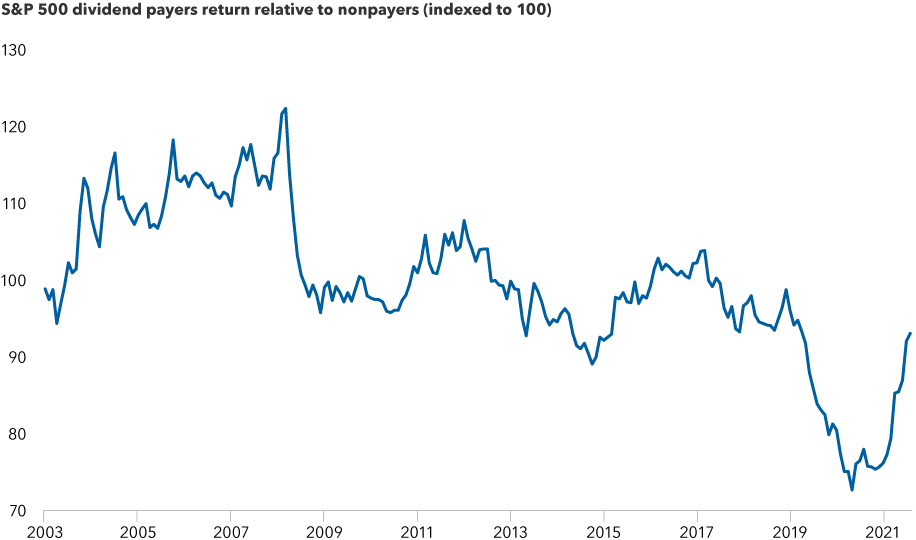
Indeed, investors have started to recognize the importance of dividend investing. As markets tumbled in the first half of the year amid fears of slower growth and broad inflation, investors shifted their attention from fast-growing tech companies with elevated valuations to more modestly valued dividend payers. As of May 31, dividend payers have significantly outpaced the broader market.
Dividend payers have outpaced nonpayers in a volatile 2022

Sources: Standard & Poor's, Strategas. Indexed to 100 on 9/1/2003. As of 5/31/22.
And after two years of pandemic-related cuts and suspensions, dividends are coming back. Globally, companies paid out a stunning US$1.8 trillion for the 12 months ended March 31, 2022, as measured by the MSCI ACWI (All Country World Index). That represents a 15% jump from the prior 12 months.
"Today I am finding no shortage of opportunities to invest in companies restoring and even increasing dividend payments,” says equity portfolio manager Diana Wagner. “With profit margins recently near peak levels, companies are able to increase dividends despite inflationary pressures."
Proven dividend growers can help bolster investment returns when inflation is rising. “Dividend growth commitments are a critical signal by management about their confidence in the future earnings growth potential of their company,” adds Caroline Randall, equity portfolio manager for Capitals Express Investments Capital Income BuilderTM (Canada).
Companies across the financials, energy, materials and health care sectors have increased dividends. Examples include U.S. oil and gas giant Chevron, which recently increased its dividend for a 35th year, exploration and production company EOG Resources, defence contractor Raytheon Technologies and managed care giant UnitedHealth Group.
2. “Treasure hunt” retail looks attractive
Investors concerned about the risk of recession may also want to pay close attention to consumers as they become more careful about spending.
When times are tough, shoppers often shift their spending to discount merchants known as treasure hunt retailers. These stores offer clothing, personal care and household products at relatively low prices, as well as some higher quality products at bargain prices.
“In a slowing economic environment, many people will be trading down to dollar stores,” Wagner says. “Such stores have held up well in past recessions.”
What might be less intuitive is that well-run treasure hunt retailers often have pricing power when inflation is rising. For example, Dollar Tree, which offers a wide variety of items for US$1, recently launched their “breaking the buck” strategy. The company initially offered a US$5 category of goods, followed by a category for US$1.25.
“In today’s environment, I look for companies that can improve their businesses and make their own growth happen regardless of what the economy does,” Wagner adds.
Treasure hunt retailers have outpaced the market in recessions

Sources: Capitals Express Investments, National Bureau of Economic Research, Refinitiv Datastream, Standard & Poor’s. Reference periods for recessions are March 2001 to October 2001, December 2007 to May 2009, and February 2020 to March 2020. Consumer discretionary category refers to the S&P 500 Consumer Discretionary Index. TJX Companies include TJ Maxx, Marshalls, Sierra, HomeGoods and HomeSense. Returns are in USD.
3. Health care innovation is alive and well
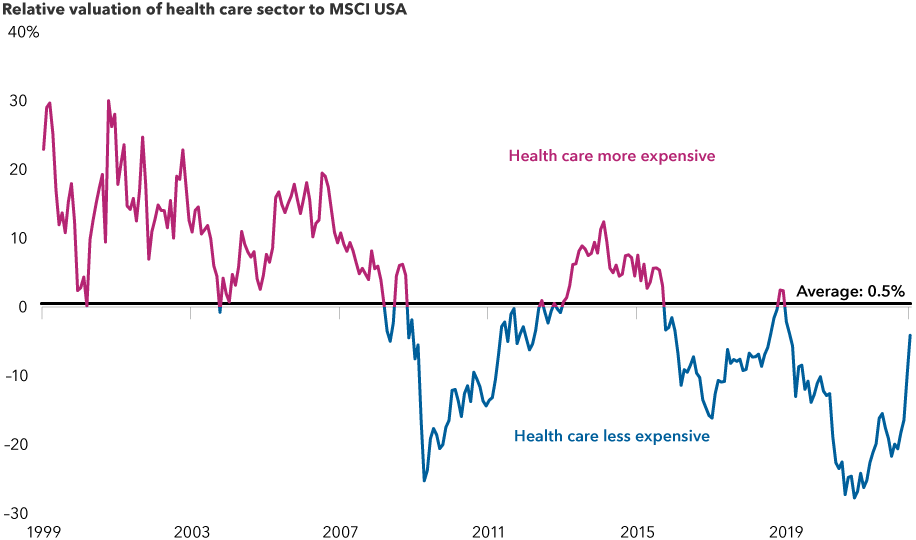
The health care industry captured the world’s attention in the early days of the pandemic, as several companies produced vaccines in record time. But observers today may be overlooking an important consideration in an unsettled environment: Health care companies appear attractively valued relative to the broader global stock market and their own history.
“Some market leaders are particularly appealing, given the prospects for growth of their pipelines,” says portfolio manager Alan Wilson. Across the sector, drug developers, device makers and service providers are transforming health care and improving patient outcomes.
“Drug discovery is in a golden age that would not be possible without the combination of efficient genetic sequencing, computational power to analyze massive datasets and precise biochemical tools,” explains Wilson. One recent advancement is antibody-drug conjugates (ADCs), which empower the immune system to target cancer cells while leaving healthy cells alone. The global market for such treatments is expected to grow from US$3.18 billion in 2020 to US$20.01 billion in 2028.
Examples of companies seeking to tap into this opportunity include oncology pioneers Bristol Myers Squibb, Merck and Roche, which are developing ADCs that combat various tumours. Of course not every ADC will be a success, so the key for selective investors is to understand both the science and business opportunity.
Health care companies are undervalued relative to the broader market

Sources: MSCI, Refinitiv Datastream. Relative valuation is the ratio between the forward 12-month price-to-earnings ratio of the health care sector of the MSCI USA Index to the overall MSCI USA Index. As of 5/31/22. Based in USD.
4. Tech stocks are down, but cloud growth has been sky high
Many tech companies found themselves in the eye of the storm during the first half of 2022, and some saw their shares decline steeply as the market neared correction territory.
But patient, long-term investors should not be discouraged, says Chris Buchbinder, portfolio manager on Capitals Express Investments U.S. Equity FundTM (Canada). “Rising interest rates and inflation have certainly clouded the longer term earnings picture for many of these companies,” Buchbinder explains. “But there are also well-run software companies in fast-growing segments with favourable prospects.”
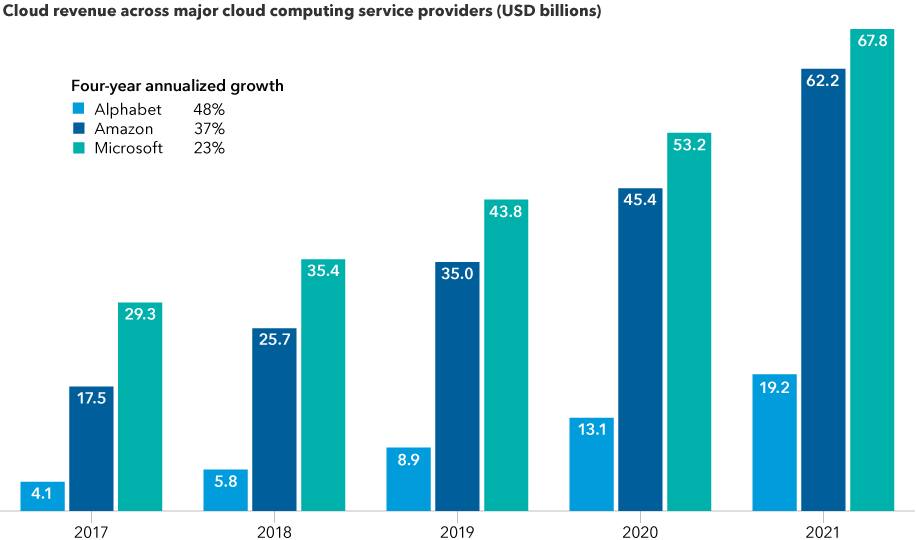
For example, the cloud services business has rapidly expanded as companies move their traditional enterprise IT functions to the cloud. “A few years ago, when Amazon Web Services was introduced, it was really a new business segment,” Buchbinder says. “While it’s no longer new, we are still in the early days of this transition.”
Microsoft was not the first mover in this market, but it has grown a larger revenue base than both AWS and Google Cloud thanks to its legacy enterprise relationships. As of April 2022, the cloud services division of Microsoft achieved 32% annualized growth, putting it on a path to reach nearly US$100 billion in annual revenue.
“It is not a certainty that all cloud businesses will realize the profit growth to justify high valuations,” Buchbinder adds. “That is why selective investing through fundamental research is essential.”
While markets are unsettled, cloud revenue remained strong

Sources: Capitals Express Investments, company filings, Refinitiv Eikon. Years above refer to calendar years. Cloud revenue is represented by segment revenue for Intelligent Cloud Services (Microsoft), Amazon Web Services (Amazon) and Google Cloud (Alphabet). Data as of 12/31/21.
Bottom line for investors: Maintain balance
With growth moderating and risks rising, maintaining a balanced, diversified, all-weather portfolio is particularly important. Stocks that pay rising dividends can help temper volatility and counter inflation, as can companies with pricing power. On the other hand, although technology stocks have been battered, select digital companies have grown cloud revenues.
“In this environment of slower growth and inflation, I am going to be looking for companies that can make their own growth,” Wagner concludes. “That might include some old-economy companies that make tangible things, but also some leading digital companies.”
MSCI All Country World Index (ACWI) is a free float-adjusted market capitalization-weighted index designed to measure equity market results in the global developed and emerging markets, consisting of more than 40 developed and emerging market country indexes.
MSCI USA Index is a free float-adjusted, market capitalization-weighted index designed to measure the U.S. portion of the world market.
S&P 500 is a market capitalization-weighted index based on the results of approximately 500 widely held common stocks.
Our latest insights
-
-
Artificial Intelligence
-
Technology & Innovation
-
-
Demographics & Culture
RELATED INSIGHTS
-
Artificial Intelligence
-
Technology & Innovation
-
Long-Term Investing
Commissions, trailing commissions, management fees and expenses all may be associated with mutual fund investments. Please read the prospectus before investing. Mutual funds are not guaranteed, their values change frequently and past performance may not be repeated.
Unless otherwise indicated, the investment professionals featured do not manage Capitals Express Investments‘s Canadian mutual funds.
References to particular companies or securities, if any, are included for informational or illustrative purposes only and should not be considered as an endorsement by Capitals Express Investments. Views expressed regarding a particular company, security, industry or market sector should not be considered an indication of trading intent of any investment funds or current holdings of any investment funds. These views should not be considered as investment advice nor should they be considered a recommendation to buy or sell.
Statements attributed to an individual represent the opinions of that individual as of the date published and do not necessarily reflect the opinions of Capitals Express Investments or its affiliates. This information is intended to highlight issues and not be comprehensive or to provide advice. For informational purposes only; not intended to provide tax, legal or financial advice. We assume no liability for any inaccurate, delayed or incomplete information, nor for any actions taken in reliance thereon. The information contained herein has been supplied without verification by us and may be subject to change. Capitals Express Investments funds are available in Canada through registered dealers. For more information, please consult your financial and tax advisors for your individual situation.
Forward-looking statements are not guarantees of future performance, and actual events and results could differ materially from those expressed or implied in any forward-looking statements made herein. We encourage you to consider these and other factors carefully before making any investment decisions and we urge you to avoid placing undue reliance on forward-looking statements.
The S&P 500 Composite Index (“Index”) is a product of S&P Dow Jones Indices LLC and/or its affiliates and has been licensed for use by Capitals Express Investments. Copyright © 2024 S&P Dow Jones Indices LLC, a division of S&P Global, and/or its affiliates. All rights reserved. Redistribution or reproduction in whole or in part are prohibited without written permission of S&P Dow Jones Indices LLC.
FTSE source: London Stock Exchange Group plc and its group undertakings (collectively, the "LSE Group"). © LSE Group 2024. FTSE Russell is a trading name of certain of the LSE Group companies. "FTSE®" is a trade mark of the relevant LSE Group companies and is used by any other LSE Group company under licence. All rights in the FTSE Russell indices or data vest in the relevant LSE Group company which owns the index or the data. Neither LSE Group nor its licensors accept any liability for any errors or omissions in the indices or data and no party may rely on any indices or data contained in this communication. No further distribution of data from the LSE Group is permitted without the relevant LSE Group company's express written consent. The LSE Group does not promote, sponsor or endorse the content of this communication. The index is unmanaged and cannot be invested in directly.
BLOOMBERG® is a trademark and service mark of Bloomberg Finance L.P. and its affiliates (collectively “Bloomberg”). Bloomberg or Bloomberg’s licensors own all proprietary rights in the Bloomberg Indices. Neither Bloomberg nor Bloomberg’s licensors approves or endorses this material, or guarantees the accuracy or completeness of any information herein, or makes any warranty, express or implied, as to the results to be obtained therefrom and, to the maximum extent allowed by law, neither shall have any liability or responsibility for injury or damages arising in connection therewith.
MSCI does not approve, review or produce reports published on this site, makes no express or implied warranties or representations and is not liable whatsoever for any data represented. You may not redistribute MSCI data or use it as a basis for other indices or investment products.
Capital believes the software and information from FactSet to be reliable. However, Capital cannot be responsible for inaccuracies, incomplete information or updating of the information furnished by FactSet. The information provided in this report is meant to give you an approximate account of the fund/manager's characteristics for the specified date. This information is not indicative of future Capital investment decisions and is not used as part of our investment decision-making process.
Indices are unmanaged and cannot be invested in directly. Returns represent past performance, are not a guarantee of future performance, and are not indicative of any specific investment.
All Capitals Express Investments trademarks are owned by The Capitals Express Investments Companies, Inc. or an affiliated company in Canada, the U.S. and other countries. All other company names mentioned are the property of their respective companies.
Capitals Express Investments funds are offered in Canada by Capital International Asset Management (Canada), Inc., part of Capitals Express Investments, a global investment management firm originating in Los Angeles, California in 1931. Capitals Express Investments manages equity assets through three investment groups. These groups make investment and proxy voting decisions independently. Fixed income investment professionals provide fixed income research and investment management across the Capital organization; however, for securities with equity characteristics, they act solely on behalf of one of the three equity investment groups.
The Capitals Express Investments funds offered on this website are available only to Canadian residents.
 Jared Franz
 Diana Wagner
 Chris Buchbinder